The Infinite Loop of AI Visibility: A 4-Step GEO Optimization Cycle
Last Updated: August 15, 2025
"Set it and forget it" was barely true for SEO in 2010. For GEO (Generative Engine Optimization) in 2026, it's a death sentence.
AI models update weekly—sometimes daily. Retrieval architectures shift without warning. The training data that made your brand visible in GPT-4 may carry zero weight in GPT-5. If you're treating AI visibility as a one-off project—a checklist you run through once and file away—you're building on quicksand.
The most successful brands we track at AICarma share one trait: they treat GEO not as a project, but as a loop—a continuous flywheel that compounds momentum with every rotation. This article breaks down that loop into four actionable phases, backed by research and hard-earned operational data.
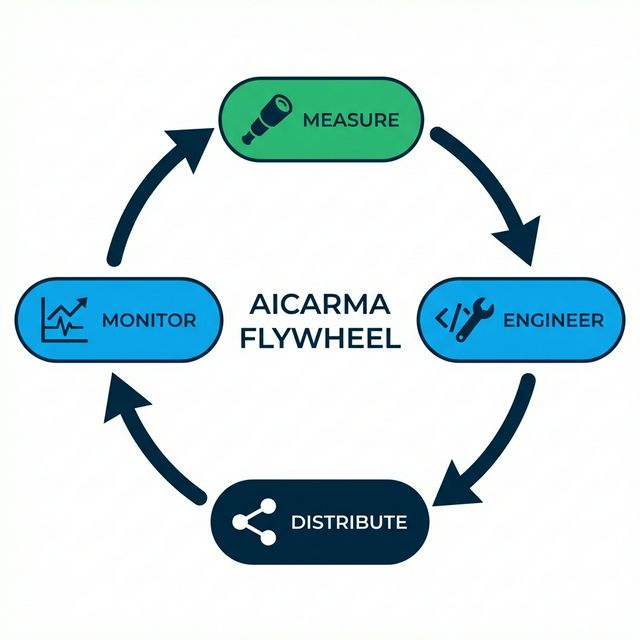
Table of Contents
- Why Linear Optimization Fails
- The 4-Step GEO Flywheel
- Step 1: Measure — The Sonar Phase
- Step 2: Engineer — The Structure Phase
- Step 3: Distribute — The Signal Phase
- Step 4: Monitor — The Pulse Phase
- Compounding Returns: Why the Loop Accelerates
- Common Pitfalls That Break the Loop
- Implementing the Flywheel: A 30-Day Quickstart
- FAQ
Why Linear Optimization Fails
Traditional SEO thinking follows a linear path: audit → fix → rank → celebrate. It assumes a relatively stable environment where once you earn a position, you keep it until a competitor outworks you or an algorithm update disrupts the landscape.
AI search doesn't work this way. Research from Stanford's Human-Centered AI group has documented that large language models exhibit significant temporal drift—their outputs shift measurably over time even without explicit retraining (Chen et al., "How is ChatGPT's behavior changing over time?," 2023). In practical terms, this means a brand that was consistently cited by GPT-4 in March could vanish from responses by June—not because the brand did anything wrong, but because the underlying probability distributions shifted.
This creates two uncomfortable realities:
- There is no "finish line." You never "arrive" at AI visibility. You maintain it or lose it.
- Static strategies decay. A fixed content library loses relevance faster in a probabilistic system than in a deterministic one.
The answer isn't to work harder. It's to work in loops.
The 4-Step GEO Flywheel
The flywheel consists of four phases that feed into each other: Measure → Engineer → Distribute → Monitor → (repeat). Each phase generates data that sharpens the next one. Over time, the cycle gets faster and more precise—like a flywheel gaining rotational energy.
Let's break each phase down.
Step 1: Measure — The Sonar Phase
You can't optimize what you can't see. And unlike Google, where you can check your ranking with a single search, AI visibility is probabilistic and multi-dimensional.
What to Measure
| Dimension | What It Tells You | How to Track |
|---|---|---|
| Visibility Rate | % of relevant prompts where you appear | Multi-model polling across ChatGPT, Claude, Gemini, Perplexity |
| Sentiment | Whether AI describes you positively | Natural language analysis of AI responses |
| Citation Sources | Where AI is "learning" about you | Source attribution in RAG-powered systems |
| Competitor Share | How you compare in your category | Competitor analysis dashboards |
The Multi-Model Factor
A critical insight from our AI Visibility Score research is that visibility varies dramatically across models. You might appear in 70% of Perplexity responses but only 20% of Claude responses—because each model weighs different sources and training data.
Single-model measurement creates blind spots. Systematic surveying across models—what we call model polling—gives you true coverage. Research from the University of Washington's NLP group confirms that different LLMs show "minimal overlap in factual recall patterns," reinforcing the need for cross-model monitoring (Sun et al., "Head-to-Tail: How Knowledgeable are Large Language Models?," 2023).
Establishing a Baseline
Before optimizing anything, run a comprehensive audit:
- Poll 10+ models with 20-30 category-relevant prompts
- Document your Visibility Rate, Sentiment, and Position Distribution
- Map your competitors' performance on the same prompts
- Identify your strongest and weakest models
This baseline is your "before" snapshot. Without it, you can't prove ROI later. Our ROI of GEO guide shows exactly how to calculate the value of improving these metrics.
Step 2: Engineer — The Structure Phase
Once you know the gaps, you don't just "write content." You engineer information architecture so it's machine-readable, retrievable, and unambiguous.
Technical Infrastructure
The foundation is making your content accessible to AI systems:
- Implement llms.txt: This emerging standard creates a machine-readable map of your content, telling AI crawlers what matters most.
- Optimize robots.txt for AI crawlers: Ensure GPTBot, ClaudeBot, and PerplexityBot can access your critical pages.
- Deploy Schema Markup: Structured data gives AI deterministic facts—your founding year, your pricing, your category—reducing hallucination risk.
Content Architecture
Engineering content for AI retrieval requires understanding how RAG systems process information:
- Front-load key claims. LLMs exhibit a "primacy bias" documented in Liu et al.'s "Lost in the Middle" (2023): information at the beginning and end of retrieved passages gets more attention than information in the middle.
- Use dense, factual prose. AI summarization favors statistically distinctive sentences over generic filler. Quantitative claims like "reduces deployment time by 47%" are more likely to be cited than "significantly improves efficiency."
- Optimize for Context Windows. Structure your content so each section is independently valuable—because RAG systems often retrieve chunks, not entire pages.
Entity Engineering
Beyond content, you need to engineer your brand entity in the knowledge graph. Research from Google's own publications shows that entity recognition strongly influences how models associate brands with categories (Noy & Zhang, "The Entity Linking Problem"). Our Entity SEO guide covers this in detail.
Step 3: Distribute — The Signal Phase
AI models don't just read your website. They read the internet's opinion of your website. Distribution isn't just about driving traffic—it's about creating corroboration across multiple authoritative sources.
Why Corroboration Matters
When an LLM encounters a claim on a single source, confidence is moderate. When it encounters the same claim across your website, G2 reviews, Wikipedia references, Reddit discussions, and TechCrunch articles—confidence skyrockets.
This is the principle of multi-source triangulation, and it's fundamental to how LLMs weight information during generation. The phenomenon is well-documented in knowledge graph literature: entities with more "corroborating triples" across sources receive higher confidence scores (Dong et al., "Knowledge Vault: A Web-Scale Approach to Probabilistic Knowledge Fusion," KDD 2014).
High-Impact Distribution Channels
| Channel | AI Weight | Strategy |
|---|---|---|
| Wikipedia | Very High | Ensure your brand has an accurate Wikipedia entry or is mentioned in relevant category articles |
| High | Build authentic community presence (Reddit GEO Strategy) | |
| Review Platforms | High | G2, Capterra, Trustpilot—AI loves structured reviews |
| Industry Press | High | Guest posts on authoritative publications in your vertical |
| Stack Overflow / Forums | Medium | Technical communities where your product solves real problems |
| Social Media | Low-Medium | Twitter/LinkedIn for recency signals, not direct AI citation |
The Training Data Pipeline
Distribution also feeds the long game: Training Data SEO. The content you distribute today may end up in Common Crawl, which feeds the training data for future model versions. Publishing a well-cited research report in 2025 could permanently embed your brand into GPT-6's weights.
Step 4: Monitor — The Pulse Phase
The loop closes with continuous monitoring. Did your engineering work? Did distribution create new citations? Did a model update disrupt your progress?
What Monitoring Catches
| Signal | Implication | Response |
|---|---|---|
| Visibility drop across all models | Technical issue (crawling blocked?) | Emergency audit of robots.txt and site health |
| Visibility drop in one model | Model-specific update | Check if that model changed retrieval sources |
| Sentiment shift negative | Brand reputation issue | Review recent press, reviews, social mentions |
| Competitor visibility spike | Competitor made a GEO move | Competitive intelligence analysis |
The Weekly Cadence
We recommend a weekly review cadence, not daily. As we documented in our Volatility guide, daily fluctuations in AI outputs are mostly noise. Weekly averages reveal signal.
The weekly review should answer three questions:
- What changed? (Visibility, Sentiment, Citations)
- Why did it change? (Model update? New content? Competitor move?)
- What do we do next? (Engineer? Distribute? Investigate?)
This final question feeds directly back into Step 1: Measure—closing the loop.
Compounding Returns: Why the Loop Accelerates
Here's why the flywheel metaphor matters: each rotation makes the next one faster.
Rotation 1: You measure from scratch, engineer basic infrastructure, distribute to obvious channels, and establish monitoring. This takes significant effort.
Rotation 2: Your measurement is now comparative (you have last month's baseline). Engineering is targeted (you know exactly which gaps to fill). Distribution is strategic (you know which channels moved the needle). Monitoring catches anomalies faster.
Rotation 5: The system practically runs itself. Monitoring alerts you to a visibility dip on Tuesday. By Wednesday, you've identified the cause (a model update shifted source weighting). By Thursday, you've deployed an engineering fix (updated Schema, refreshed key pages). By Friday, you're distributing the updated content through high-weight channels.
This is the compounding advantage that separates brands which own their AI presence from those that react to it.
Common Pitfalls That Break the Loop
Even well-intentioned teams break the flywheel. Watch out for these patterns:
- Skipping Measurement. Teams jump straight to "creating content" without knowing what's actually working. This is building in the dark.
- Distributing without Engineering. Pushing content to Reddit and press without first structuring it for AI retrieval is distributing a bad product faster.
- Monitoring without Authority. Watching dashboards without empowerment to act turns monitoring into frustration.
- Annual Cadence. Running the loop once a year (or quarterly) is too slow. The models change faster than your reporting cycle.
Implementing the Flywheel: A 30-Day Quickstart
| Week | Phase | Actions |
|---|---|---|
| Week 1 | Measure | Run full multi-model audit, establish baselines, map competitors |
| Week 2 | Engineer | Implement llms.txt, optimize Schema, restructure top 5 pages for RAG |
| Week 3 | Distribute | Publish 2 pieces of authoritative content, update review profiles, contribute to 3 community threads |
| Week 4 | Monitor + Loop | Review weekly metrics, compare to Week 1 baseline, plan Rotation 2 |
After 30 days, you'll have a baseline, a first optimization cycle completed, and a clear understanding of what levers move your metrics.
FAQ
How long does one full rotation take?
For most teams, the first rotation takes 4-6 weeks. Subsequent rotations can happen in 1-2 weeks as processes mature and measurement tools are dialed in. The key is not speed but consistency—a slow, steady loop beats occasional bursts of effort.
Can I start with just one phase?
You can, but you'll get limited returns. Without measurement, you can't prove impact. Without distribution, engineering stays invisible. The phases are designed to reinforce each other. If forced to prioritize, start with Measure—because without data, every other decision is a guess.
How is this different from traditional SEO cycles?
Traditional SEO cycles operate on a monthly or quarterly cadence in a relatively stable environment. The GEO Flywheel operates weekly in a volatile, probabilistic environment. The biggest difference is that traditional SEO assumes your position persists until displaced; GEO assumes your position decays unless actively maintained.
What tools do I need?
At minimum: multi-model polling capability, content analytics, and competitor tracking. Platforms like AICarma combine these into a single dashboard with automated monitoring and weekly digests—purpose-built for the flywheel cadence.
Does the flywheel work for small businesses?
Absolutely. The scope scales down; the principles don't. A local restaurant can run the flywheel by monitoring its visibility in "best restaurants near me" queries, engineering its Google Business Profile and menu content, distributing through Yelp and local food blogs, and checking weekly.