ROI of GEO: How to Calculate the Value of an AI Citation
Last Updated: June 15, 2025
"Our website traffic is down 20%, but somehow our revenue is up 15%. What's going on?"
This confused question from a CMO captures the paradox of the AI era. If you're measuring success by traffic volume, the AI revolution looks like a disaster. If you're measuring by revenue and conversion, it might be the best thing that's ever happened to your marketing.
The explanation? AI pre-qualifies your visitors. When someone clicks through from a ChatGPT recommendation, they've already learned about your product, had their objections addressed, and been recommended by a trusted source. They arrive ready to buy, not ready to browse.
This fundamentally changes how we calculate marketing ROI. Let's learn how to measure the true value of Generative Engine Optimization—and how to prove it to skeptical stakeholders.
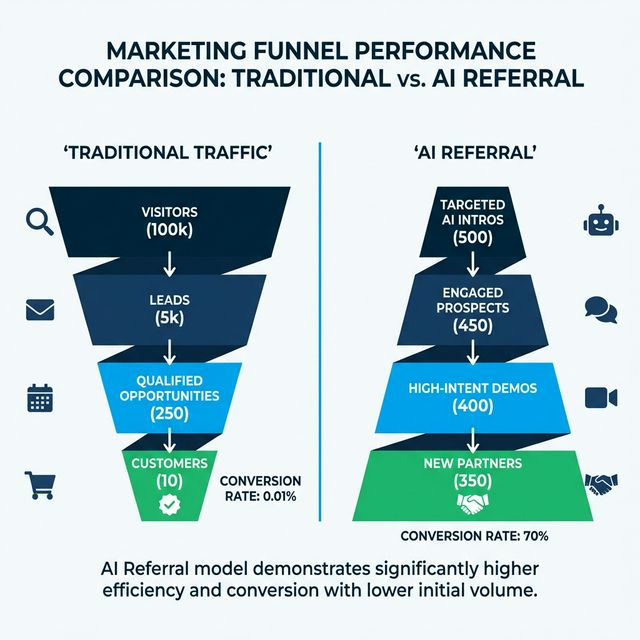
Table of Contents
- The Quality vs. Quantity Shift
- Understanding AI-Driven Traffic
- Calculating the Value of an AI Citation
- The Trust Multiplier Effect
- Attribution Challenges and Solutions
- The Brand Equity Bonus
- Building a GEO ROI Model
- Case Study: GEO ROI in Practice
- Presenting GEO ROI to Stakeholders
- FAQ
The Quality vs. Quantity Shift
Traditional marketing math emphasized volume:
Traffic × Conversion Rate × Average Order Value = Revenue
Under this model, more traffic = more revenue. Marketing optimized for eyeballs.
But AI changes this equation dramatically because it doesn't just send traffic—it sends pre-qualified traffic.
The Conversion Rate Gap
| Traffic Source | Typical Conversion Rate | Why |
|---|---|---|
| Paid Search | 2-4% | Users click ads, have intent |
| Organic Search | 1-3% | Users found you, have curiosity |
| Social Media | 0.5-1.5% | Casual discovery |
| AI Recommendation | 8-15% | Pre-qualified by trusted advisor |
That 8-15% isn't a typo. When an AI tells someone "Based on your needs, [Your Brand] is the best option," that person arrives with:
- Understanding of what you offer
- Belief that you're a fit for their needs
- Trust borrowed from the AI
- Intent to act, not just browse
Old Funnel vs. AI Funnel
Traditional Funnel (SEO Era):
Awareness → Interest → Consideration → Intent → Purchase
   ↓          ↓           ↓           ↓          ↓
 1000      → 300       → 50       → 20      → 10 (1% conv.)
Compressed Funnel (AI Era):
AI Research → Recommendation → Decision → Purchase
      ↓              ↓            ↓          ↓
  (happens in AI) → 100       → 60      → 40 (40% conv.)
The AI handles the awareness, interest, and consideration stages. By the time users reach you, they're already in the decision stage.
Understanding AI-Driven Traffic
Before calculating ROI, you need to identify and measure AI-driven traffic.
Types of AI Traffic
| Type | Source | Tracking Method |
|---|---|---|
| Direct Referral | User clicks a citation link in ChatGPT | Referrer header from chat.openai.com |
| RAG Referral | User clicks source link in Perplexity | perplexity.ai referrer |
| Brand Search | User learns about you from AI, then Googles | Branded search volume correlation |
| Direct Navigation | User remembers your name from AI | Self-reported attribution |
| Dark Social | User shares AI recommendation privately | UTM tracking + surveys |
Identifying AI Source Traffic
In Google Analytics 4 or your analytics platform, look for:
| Referrer Domain | Corresponds To |
|---|---|
chat.openai.com |
ChatGPT |
perplexity.ai |
Perplexity |
gemini.google.com |
Google Gemini |
claude.ai |
Claude |
bing.com/chat |
Bing Chat |
The Visibility → Traffic → Revenue Chain
Visibility Score (50%) → AI Citations → Clicks → Visits → Conversions → Revenue
At each stage, you can estimate drop-off rates:
- 50% visibility × 1000 relevant prompts/month = 500 citations
- 500 citations × 10% CTR = 50 visits
- 50 visits × 15% conversion = 7.5 conversions
- 7.5 × $500 AOV = $3,750/month from this query category
Calculating the Value of an AI Citation
Here's a framework for calculating the dollar value of an AI citation:
The Citation Value Formula
Citation Value = Search Volume × Visibility Rate × CTR × Conversion Rate × AOV × LTV Multiplier
Where:
- Search Volume: Monthly prompts on this topic (estimated)
- Visibility Rate: Your AI Visibility Score for this query
- CTR: Click-through rate from citation to visit
- Conversion Rate: Visit to purchase rate
- AOV: Average Order Value
- LTV Multiplier: If repeat purchases, multiply by customer lifetime value ratio
Example Calculation
Query: "Best CRM for startups" Estimated Monthly Prompts: 10,000 Your Visibility Rate: 30% CTR Estimate: 8% Conversion Rate: 12% AOV: $600 LTV Multiplier: 2.5× (customers stay 30 months on average)
Citation Value = 10,000 × 0.30 × 0.08 × 0.12 × $600 × 2.5
              = 3,000 × 0.08 × 0.12 × $600 × 2.5
              = 240 × 0.12 × $600 × 2.5
              = 28.8 × $600 × 2.5
              = $17,280 × 2.5
              = $43,200/month potential value
This one query category, at 30% visibility, could generate $43,200/month in lifetime value.
The Trust Multiplier Effect
AI recommendations carry what we call the Trust Multiplier—a reflection of borrowed credibility from the AI.
Why AI Recommendations Drive Higher Conversion
- Third-Party Validation: AI is perceived as neutral arbiter
- Pre-Qualification: AI has already filtered bad fits
- Objection Handling: AI answers questions before user visits
- Decision Facilitation: AI reduces cognitive load of comparison
- Implicit Authority: "ChatGPT says this is best" carries weight
Measuring the Trust Multiplier
Compare conversion rates:
| Traffic Source | Conv. Rate | Trust Multiplier |
|---|---|---|
| Organic Search | 2.0% | 1.0× (baseline) |
| AI Recommendation | 12.0% | 6.0× |
This 6× difference is your Trust Multiplier for that traffic source.
Applying the Multiplier
When forecasting GEO impact:
Expected Revenue = Baseline Traffic × Baseline Conv. × Trust Multiplier
Even if AI sends less raw traffic than SEO, the Trust Multiplier can make it more valuable per visit.
Attribution Challenges and Solutions
AI traffic attribution is imperfect. Here's how to handle the gaps:
Challenge 1: Dark Attribution
AI recommendation → User remembers brand → Types URL directly → Attributed as "Direct"
Solution: Track branded search + direct traffic as a combined "AI-influenced" bucket. If branded search rises after visibility improves, attribute some portion to AI.
Challenge 2: Missing Referrers
Some AI platforms don't pass referrer data cleanly.
Solution: Implement UTM-tagged links in your content that AI might retrieve. Example: "Visit aicarma.io/demo?utm_source=aicitation" gives you trackable URLs even when the AI copies your content.
Challenge 3: Delayed Attribution
User sees AI recommendation → Researches you separately → Converts weeks later
Solution: Self-reported attribution. Add "How did you hear about us?" with "AI recommendation (ChatGPT, etc.)" as an option. You'll be surprised how many select it.
Combined Attribution Framework
| Attribution Method | What It Captures | Accuracy |
|---|---|---|
| Referrer Tracking | Direct AI clicks | High |
| Branded Search Correlation | AI awareness → Search | Medium |
| Self-Reported | All AI influence | Medium |
| Control Group Analysis | Total AI impact | High (complex) |
For comprehensive measurement, use all four methods.
The Brand Equity Bonus
Beyond direct conversions, AI citations build brand equity—value that doesn't immediately appear in analytics but accumulates over time.
The "As Recommended By" Effect
When ChatGPT says "[Your Brand] is the leading solution for X," it's like getting an endorsement from a trusted celebrity—but at scale, in real-time, to exactly the right audience.
This creates:
- Increased brand recall
- Positive sentiment association
- Decision shortlist inclusion
- Price premium tolerance
Measuring Brand Equity Impact
| Indicator | How to Measure | GEO Impact |
|---|---|---|
| Brand Search Volume | GSC | Should increase over time |
| Share of Search | Semrush / Ahrefs | Growing vs. competitors |
| Brand Perception Surveys | Qualitative research | "How did you hear about us?" |
| Pricing Power | A/B test pricing | Can you command premium? |
| Sales Cycle Length | CRM data | AI recommendations shorten cycles |
The Long-Term Compounding Effect
Brand equity compounds:
- AI recommends you → More users recognize you
- Users discuss you → More training data
- More training data → AI recommends you more confidently
- Higher confidence → Better visibility → Repeat
The ROI calculation should account for this compounding effect.
Building a GEO ROI Model
Here's a complete model for calculating GEO return on investment:
Input Variables
| Variable | Source | Example |
|---|---|---|
| GEO Investment | Your budget | $10,000/month |
| Target Query Categories | Research | 5 categories |
| Estimated Total Prompts | Industry research | 50,000/month |
| Current Visibility Rate | AICarma / testing | 15% |
| Target Visibility Rate | Goals | 35% |
| Citation CTR | Analytics / estimate | 8% |
| Conversion Rate | Analytics | 10% |
| Average Order Value | Sales data | $800 |
| Customer LTV | Finance | $2,400 |
GEO ROI Formula
Visibility Improvement = Target Rate - Current Rate = 35% - 15% = 20%

Additional Citations = Total Prompts × Visibility Improvement
                    = 50,000 × 0.20 = 10,000

Additional Visits = Additional Citations × CTR
                  = 10,000 × 0.08 = 800

Additional Customers = Additional Visits × Conversion Rate
                     = 800 × 0.10 = 80

Revenue Impact = Additional Customers × LTV
               = 80 × $2,400 = $192,000

GEO ROI = (Revenue Impact - Investment) / Investment
        = ($192,000 - $10,000) / $10,000
        = 1,820% annual ROI
Sensitivity Analysis
| Visibility Improvement | Revenue Impact | ROI |
|---|---|---|
| +5% | $48,000 | 380% |
| +10% | $96,000 | 860% |
| +20% | $192,000 | 1,820% |
| +30% | $288,000 | 2,780% |
Case Study: GEO ROI in Practice
Company: B2B SaaS in analytics space GEO Investment: $8,000/month (3 months = $24,000) Starting Visibility: 8% Ending Visibility: 41%
Investment Allocation
| Category | Allocation | Actions |
|---|---|---|
| Technical Optimization | $5,000 | Schema, robots.txt, page speed |
| Content Creation | $12,000 | 10 comparison articles, FAQs |
| Entity Building | $4,000 | Directory profiles, press |
| Monitoring | $3,000 | AICarma subscription |
Results (90 Days)
| Metric | Before | After | Change |
|---|---|---|---|
| AI Visibility Score | 8% | 41% | +33 pts |
| AI-Referred Traffic | 120/mo | 890/mo | +642% |
| AI Traffic Conversion | 9% | 12% | +3 pts |
| Monthly AI Revenue | $6,400 | $64,000 | +900% |
ROI Calculation
Quarter Investment: $24,000
Quarter Revenue Increase: ($64,000 - $6,400) × 3 = $172,800
ROI = ($172,800 - $24,000) / $24,000 = 620%
Payback period: Less than 2 months.
Presenting GEO ROI to Stakeholders
When presenting to executives, CFOs, or boards:
Frame It in Business Terms
Don't say: "Our visibility score increased from 15% to 35%" Say: "We're now recommended in 35% of relevant AI conversations, up from 15%. This represents an additional 80 customers/month at current conversion rates."
Show the Revenue Bridge
| Source | Current | After GEO | Impact |
|---|---|---|---|
| Organic Search | $100,000 | $95,000 | -$5,000 |
| AI Referral | $10,000 | $75,000 | +$65,000 |
| AI-Influenced Brand Search | $5,000 | $30,000 | +$25,000 |
| Total | $115,000 | $200,000 | +$85,000 |
Address the Traffic Concern Proactively
"You'll notice organic traffic decreased slightly. This isn't because our SEO worsened—it's because users who previously clicked 5 pages now get their answers from AI and click once, to convert. Traffic quality has dramatically increased even as raw volume normalized."
FAQ
How long until I see GEO ROI?
Typical timeline: 3-6 months for meaningful results. Technical fixes (robots.txt, Schema) can impact live search visibility within weeks. Training data influence takes longer—new model versions release every 3-6 months.
Can GEO cannibalize my organic search traffic?
Some cannibalization happens—users who would've searched now get answers from AI. But AI often reaches users who wouldn't have searched at all, expanding your total addressable audience. Net impact is typically positive if you're among those recommended.
How do I track conversions specifically from AI?
Combine methods: analyze referrer traffic from AI domains, track branded search volume correlation with visibility improvements, use self-reported attribution surveys, and consider holdout testing if scale allows.
Is GEO ROI sustainable or will it decline as competition increases?
Early movers have significant advantages—you're building entity strength and training data presence that compounds over time. ROI may moderate as competition intensifies, but first-movers establish defensible positions.
Should I reallocate budget from SEO to GEO?
Not entirely—SEO still drives traffic and enables crawling for AI training data. Think of GEO as an evolution of SEO investment, not a replacement. Many GEO activities (Schema, content quality) improve SEO too. For enterprise organizations considering build vs. buy decisions for AI monitoring infrastructure, see our complete economic analysis.