AI Search Volatility: Why Monthly Ranking Reports Are Now Useless
Last Updated: August 1, 2025
Your client asks: "What's our ranking in ChatGPT?"
You freeze. Because the honest answer is: "It depends on when you ask, which model version is running, what the temperature setting is, and whether Mercury is in retrograde."
Welcome to the chaotic world of AI Search Volatility—where yesterday's AI darling is today's forgotten brand, and a result that appeared 80% of the time last week now shows up 30% of the time.
If you're still sending monthly ranking reports, you're essentially lying. Traditional rankings were relatively stable—if you were #3 on Monday, you were probably #3 on Friday. AI recommendations are probabilistic, non-deterministic, and genuinely volatile.
Understanding and measuring this volatility isn't just academic. It fundamentally changes how you report performance, set expectations, and plan strategy.
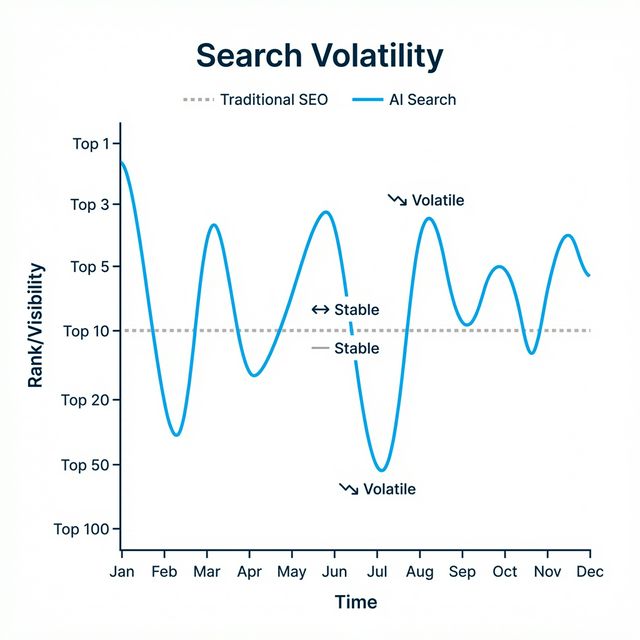
Table of Contents
- The Fundamental Difference: Determinism vs. Probability
- What Causes AI Volatility?
- Citation Drift: The New Phenomenon
- Measuring Volatility: New Metrics for a New Era
- How to Report AI Performance to Stakeholders
- Volatility as Opportunity
- Stabilizing Your Position
- Industry Volatility Benchmarks
- FAQ
The Fundamental Difference: Determinism vs. Probability
Traditional Search: Deterministic
Google Search (for the most part) is deterministic. Given the same query from the same location, you'll get largely the same results. Small variations exist (personalization, A/B tests), but the system is fundamentally stable.
This enabled traditional SEO metrics:
- "We rank #3 for [keyword]"
- "Our ranking improved from #7 to #4"
- "We achieved a stable Page One position"
These statements are meaningful because the underlying system is consistent.
AI Search: Probabilistic
AI responses are probabilistic. The same prompt can yield different results because:
- Temperature Setting: LLMs have a "temperature" parameter controlling randomness
- Sampling Strategy: Models randomly sample from probability distributions
- Context Variation: Slight differences in conversation context affect outputs
- Model Updates: Silent updates change behavior
The result? Ask ChatGPT "What's the best project management tool?" 10 times, and you might get:
- Run 1-3: Asana, Monday.com, Notion
- Run 4-5: Monday.com, Asana, ClickUp
- Run 6-7: Notion, Asana, Monday.com
- Run 8-10: Asana, Trello, Monday.com
You cannot have a "ranking" in a probabilistic system. You can only have a probability of citation. This is why enterprise reputation teams are increasingly adopting Share of Model metrics that account for AI's inherent variability.
What Causes AI Volatility?
Understanding why AI results are volatile helps you predict and manage it:
Factor 1: Temperature and Sampling
LLMs generate text by predicting the next most likely token. Temperature controls how creative vs. conservative this prediction is:
| Temperature | Behavior | Result |
|---|---|---|
| Low (0.0-0.3) | Conservative, predictable | More consistent recommendations |
| Medium (0.4-0.7) | Balanced | Moderate variation |
| High (0.8-1.0) | Creative, diverse | High variation in recommendations |
You can't control the model's temperature—only AI providers can.
Factor 2: Retrieval Variance
For AI systems using RAG (Retrieval-Augmented Generation), the retrieval step introduces variance:
- Search indices update regularly
- Different retrieval methods return different sources
- Ranking of retrieved documents can vary
Factor 3: Model Updates
AI companies continuously update their models—often silently:
- Fine-tuning adjustments
- Safety patches
- Alignment changes
- Full version updates
A model change can shift your visibility overnight, even if you've done nothing.
Factor 4: Conversation Context
Unlike isolated search queries, AI conversations have memory. How a user arrived at their question affects the answer:
| Conversation History | Might Favor |
|---|---|
| "I work at a startup" | Startup-friendly tools |
| "I manage a large team" | Enterprise solutions |
| "I'm on a tight budget" | Free/cheap options |
Citation Drift: The New Phenomenon
Citation Drift is the tendency of an LLM to cite different sources for the exact same prompt over short periods.
Observed Pattern
We tracked one category query ("Best email marketing tools") over 7 days:
| Day | Top 3 Recommendations |
|---|---|
| Mon | Mailchimp, ConvertKit, ActiveCampaign |
| Tue | Mailchimp, Constant Contact, ConvertKit |
| Wed | Mailchimp, ConvertKit, Klaviyo |
| Thu | Klaviyo, Mailchimp, ConvertKit |
| Fri | Mailchimp, ActiveCampaign, Beehiiv |
| Sat | Mailchimp, ConvertKit, ActiveCampaign |
| Sun | Mailchimp, Klaviyo, ConvertKit |
Mailchimp is consistently present, but the rest rotate. If you only checked on Thursday, you'd see Klaviyo in the #1 spot—a result that didn't repeat the rest of the week.
Implications of Citation Drift
- Single-point measurement is misleading: You must sample multiple times
- Trends require averaging: Look at weekly averages, not daily snapshots
- Consistent presence > occasional #1: Being mentioned 80% of the time matters more than being first 10% of the time
Measuring Volatility: New Metrics for a New Era
We need new metrics that account for probabilistic behavior:
Core Volatility Metrics
| Metric | Definition | Calculation |
|---|---|---|
| Visibility Rate | % of queries where you appear | Appearances / Total Prompts |
| Position Distribution | Spread of where you appear | Histogram of positions |
| Consistency Score | How stable is your visibility? | 1 - Standard Deviation |
| Citation Confidence | How reliably do you appear? | 95th percentile of visibility |
| Churn Rate | How often does your position change? | Position changes / Total checks |
The Visibility Cone
Instead of reporting a single number, report a range:
Your Visibility Score: 45% (±12%)
- Lower bound (33%): Pessimistic view
- Upper bound (57%): Optimistic view
- Center (45%): Most likely
This "visibility cone" communicates the inherent uncertainty in AI metrics.
Trend Lines Beat Snapshots
| Reporting Approach | Value |
|---|---|
| "Our visibility is 45%" | Low (snapshot) |
| "Our visibility improved from 35% to 45% over 3 months" | Medium (trend) |
| "Our visibility improved 10 points with ±5% volatility band" | High (trend + uncertainty) |
How to Report AI Performance to Stakeholders
Your CEO or client wants simple answers. "What's our ranking?" Here's how to bridge the gap:
Educate on the Paradigm Shift
First, help stakeholders understand why old metrics don't apply:
Before: "We rank #3" After: "We appear in 65% of relevant AI responses"
Before: "Rankings are stable" After: "Our visibility varies between 55-75% week to week"
Before: "We moved up 2 positions" After: "Our average mention rate improved by 15%"
The Recommended Dashboard
Show these metrics in stakeholder reports:
| Metric | This Week | Last Week | 4-Week Avg | Trend |
|---|---|---|---|---|
| Visibility Rate | 52% | 48% | 50% | ↗️ |
| Consistency Score | 72% | 68% | 70% | ↗️ |
| Competitor A Visibility | 45% | 45% | 44% | → |
| Cross-Model Coverage | 3/4 | 3/4 | 3/4 | → |
Platforms like AICarma automate this tracking across 10+ models simultaneously, providing Visibility, Sentiment, and Ranking trends with volatility bands built in.
Contextualizing Volatility
"Despite a volatile environment, we've maintained consistent presence. Our visibility score has varied between 45-55% but our 4-week average shows steady improvement. We're outperforming Competitor A by 7 points."
Volatility as Opportunity
Here's the counterintuitive insight: Volatility creates opportunity.
Why Stability Would Be Bad for You
If AI recommendations were completely stable (like the old Google days), the top players would be locked in. New entrants would have almost no path to visibility.
But volatility means:
- Today's underdog can become tomorrow's recommendation
- Established players can't rest on their laurels
- There's always a chance to break through
Exploiting Volatility Windows
| Pattern | What It Means | Strategy |
|---|---|---|
| Competitor's visibility dropping | They're being "forgotten" | Increase your signal |
| New category queries emerging | Early mover advantage | Create content fast |
| Model update imminent | Performance may reshuffle | Optimize technical factors |
The "Good Volatility" vs. "Bad Volatility" Framework
Good volatility: Your visibility bounces but trends up Bad volatility: Your visibility bounces and trends down
Track your trend line through the volatility noise.
Stabilizing Your Position
While you can't eliminate volatility, you can reduce it by building strong fundamentals:
High-Stability Factors
| Factor | Why It Reduces Volatility |
|---|---|
| Strong entity presence | AI "knows" you reliably |
| Multiple authoritative sources | Corroboration builds confidence |
| Consistent Schema markup | Deterministic data reduces guessing |
| High-trust domain | Domain reputation persists through noise |
Low-Stability Factors
| Factor | Why It Increases Volatility |
|---|---|
| Weak entity presence | AI isn't sure about you |
| Single source dependency | If that source isn't retrieved, you vanish |
| Marketing-heavy content | Subjective claims get weighted differently |
| Recent entry | Less training data = less certainty |
The Corroboration Strategy
The key to stability is corroboration. If an AI finds a fact on your website, it might unsure. If it finds the same fact on your site, on G2, on Crunchbase, on a TechCrunch article, and on Reddit—confidence is high.
Build presence across multiple authoritative sources, and your visibility becomes more stable.
Industry Volatility Benchmarks
Different industries show different volatility patterns:
Low Volatility Industries
| Industry | Why | Typical Variance |
|---|---|---|
| Finance/YMYL | AI constrained by safety filters | ±5-10% |
| Healthcare | Heavy reliance on trusted sources | ±5-10% |
| Legal | Conservative recommendations | ±8-12% |
High Volatility Industries
| Industry | Why | Typical Variance |
|---|---|---|
| SaaS/Martech | Many similar options, less differentiated | ±15-25% |
| E-commerce/Retail | Price/availability changes constantly | ±20-30% |
| Content/Media | Recency and freshness matter | ±25-35% |
What This Means for You
If you're in a high-volatility industry:
- Expect fluctuations; don't panic at single-day dips
- Use longer moving averages (4-week vs. weekly)
- Focus on trend rather than snapshots
If you're in a low-volatility industry:
- Stability is achievable but harder to break into
- Getting established requires strong authority signals
- Once stable, position is more defensible
FAQ
Why is high volatility sometimes good?
High volatility means the market isn't locked down—there's room for disruption. If top incumbents are "drifting," it means the AI isn't fully committed to them yet. You have an opening to build stronger signals and capture that uncertain mindshare.
Do all AI models have the same volatility?
No. Different models show different stability patterns. Perplexity (with its heavy RAG component) tends to be more volatile because it depends on real-time retrieval. Models like Claude, which rely more heavily on training data, may be more stable but harder to influence short-term.
How do I explain AI volatility to my marketing team?
Use an analogy: traditional rankings are like chess positions—fixed until someone makes a move. AI visibility is like a stock price—constantly fluctuating based on many factors. You track trends and averages, not single-point values.
What's a "normal" amount of volatility?
For category queries, expect ±15-20% week-over-week variation as a baseline. If your volatility is higher, your position may be weak. If it's lower, you have strong fundamentals.
Should I react to daily visibility changes?
Generally, no. Daily fluctuations are mostly noise. React to sustained changes over 2-4 weeks. Exception: if visibility suddenly drops 50%+, investigate immediately—there may be a technical issue or model update.